To assist in its monetary policy decisions, the Reserve Bank of Fiji (RBF) conducts several surveys to gauge the latest performances and prospects of various sectors of the economy. These surveys capture business sentiments on key economic and financial indicators which the RBF uses in its monthly assessment of the economy. One such survey is the Retail Sales Survey (RSS) which captures activity in the retail sector in Fiji and is an indicator for consumption activity in the economy.
This article discusses the methodology and importance of the RSS in monetary policy analysis.
What is the survey about?
The RSS1 is conducted bi-annually, in June and December, to capture retailers’ expectations on their annual retail sales in current and future periods.
The survey covers retail sales of food, drinks & tobacco; building materials & hardware; motor cars & other transport equipment; clothing & textiles; household goods & appliances; other/mixed; restaurants; pharmaceuticals & chemicals; entertainment; jewellery and footwear.
How is the survey conducted?
Survey forms are disseminated by the RBF around mid-May (for the June survey) and mid-November (for the December survey) to 82 companies via email or fax. The contact list is updated prior to the issue of survey forms to ensure it includes any new businesses whose feedback would be critical to the analysis and also remove those
1 The RSS was first conducted in January 1998.
businesses that are no longer operational or have indicated that they do not wish to participate in the survey. A response time of two weeks is given to respondents. Thereafter, follow-up is done with the aim of reaching a minimum response rate of 60.0 percent.
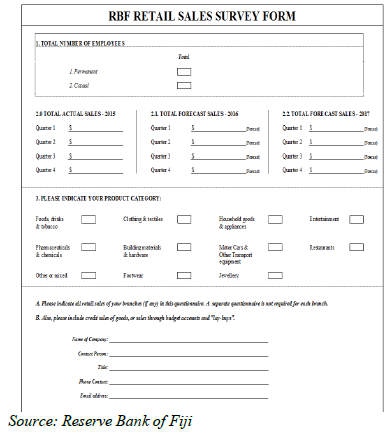
Provided below is a snapshot of the RSS form submitted to companies for completion.
Figure 1: RSS Form

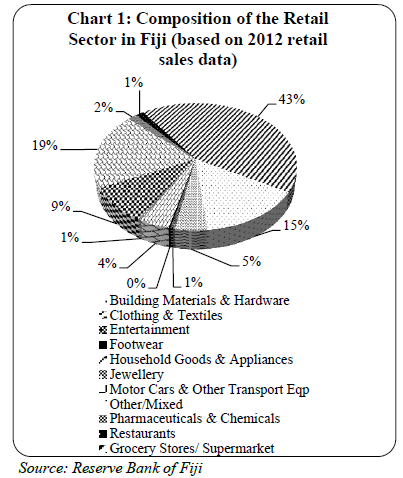
There are several methods of calculating the response rate of surveys. In this survey, the response rate2 is based on the weighted contribution of companies to overall sales in a particular base year. As shown in Chart 1, the current base year is 2012 and this is reviewed as necessary. Weighting the response rates ensures the representation of
2 Response rate refers to the number and type of companies who have responded to the RSS.
larger companies whose sentiments would influence overall activity within the sector.
The chart below shows the composition of the retail sector using the total sales data in 2012. The sector comprises eleven broad categories which are grocery stores/supermarket (43%), other/mixed (19%), building materials & hardware (15%), motor cars & other transport equipment (9%), clothing & textiles (5%), household goods & appliances (4%), pharmaceuticals & chemicals (2%), entertainment (1%), jewellery (1%), restaurant (1%) and footwear (0.2%).

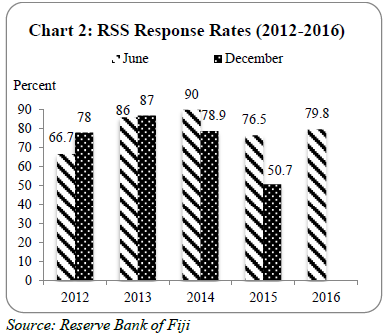
Since 2012, the response rate has generally been above the minimum target, reaching a high of 90 percent in June 2014 and a low of 50.7 percent in the December 2015 survey (Chart 2).
In the June 2016 survey, the response rate improved to 79.8 percent from 76.5 percent in June 2015, due to the timely submissions by companies and more vigorous follow-up.
Chart 2 shows the trend3 in the response rate from 2012 and 2016 and comparisons between the June and December outcomes for each year.

Analysis
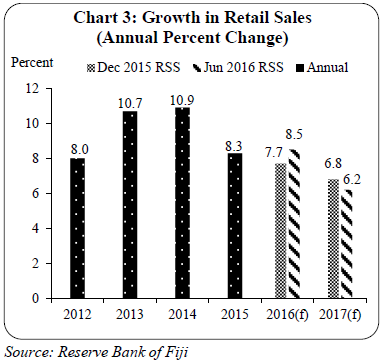
Data collected from the survey is presented using graphs and narrations. The latest June 2016 survey covered the period 2015 to 2017, including actual data for 2015 and estimates for 2016 and 2017. Chart 3 depicts the outcomes from this recent survey and comparisons with prior years’ results.
3 2012 is the benchmark year and since then the rate has on average been between 51% – 90%. Overall, the response rate increased from 2012 to 2014 then it fluctuated onwards.

According to the June 2016 RSS, retail sales rose strongly by 8.3 percent in 2015 and are estimated to have maintained a similarly strong growth of around 8.5 percent in 2016. Robust retail sales in 2015 are in line with the strong consumption activity associated with increased wholesaling and retailing activity during the year. Detailed survey data showed that sales across the 11 broad categories generally improved. Factors supporting the better performance in retail sales in 2015, included higher tourist activity, record high inward remittance inflows and the improved standard of living in urban centers.
For 2016, retail sales are expected to have risen further due to the higher demand associated with the post-Tropical Cyclone Winston rehabilitation works. Payout to households by the Fiji National Provident Fund of around $275.0 million, for reconstruction and rehabilitation purposes, also provided stimulus for consumer spending. Other assistance given by the Government under the “Help for Home Initiative” of free building materials to individuals in affected areas, has also seen an increase in purchases of building and other hardware material.
In 2017, retail sales are forecast to grow modestly by 6.2 percent; representing a slight reduction from the 6.8 percent growth earlier anticipated in the December 2015 RSS. Despite this fall, overall consumption activity is expected to remain firm this year, supported by lower VAT rates and higher disposable incomes.
Conclusion
The RSS is a useful input into the RBF’s assessment of the economy, providing an indication of overall consumption activity. In the absence of timely and high quality data, survey data provides relevant information which help guide the RBF in its monetary policy decisions.

